


Since trading the financial markets began, technical analysts have always sought to approach the financial markets using statistical principles. This approach aims to find a model to identify trends without the bias of the human mind. A statistical approach to such a model that traders and investors can use is the linear regression model. Most charting tools today identify this model as the linear regression indicator.
Introduction to the Linear Regression Model in Trading
The linear regression model is a statistical technique used to analyze and model the relationship between two variables with a given set of data values. One of the variables is dependent, while the others are independent. In trading, the dependent variable is usually the price of a financial instrument. On the other hand, the independent variables comprise relevant factors such as time and volume. Professional traders use the linear regression model to predict the future behavior of a market. The model is also used to predict how these variables interact in terms of time and price. Thus, traders can forecast market trends and price levels, enabling them to make informed decisions.
Understanding the Linear Regression Model in Trading
The linear regression indicator, or LRI, helps traders gain insight into future market performance to determine market trends and may also be used for trade signals.
The LRI tries to find the best fit between time and price by plotting a line. The user determines the time to be examined, and the LRI finds a connection between the chosen time and the current price to form a line. The Linear Regression Channel is one of the most popular indicators from the Linear Regression Model and is a handy tool to determine such a relationship.
The LRI channel consists of three lines that look like a trend line, with a middle line crossing through the channel. The three lines show the price movement’s low, medium, and high, demonstrating the price’s extreme deviation from the middle line. The chart below indicates that the high and low lines act like an upper and lower price border.

The chart illustrates the three lines that form the Linear Regression Channel. The high and low lines are used as support and resistance lines, while the middle line is the trend regression line. The middle line is drawn based on price levels, and the border lines are at equal distances from it, indicating the highs and lows of price.
How to use Linear Regression for Predictive Trading
Identifying Trend Signals
The LRI channel can be used to spot bullish or bearish trends. An upward increase in price indicates that the linear regression is positive, hence a bullish trend. A bearish channel is formed when the price decreases, and the linear regression slope is negative. Thus, the channel can be used as a support and resistance line. If the price closes outside the LRI channel over a long period, this may indicate a trend reversal.
Complementing with Other Trading Indicators and Strategies
Traders may complement the signals from the LRI channel with other trading indicators and strategies. Traders can confirm the signals from the LRI with other technical indicators such as the Bollinger bands, moving averages, the Relative Strength Index (RSI), and Moving Average Convergence Divergence (MACD).
For example, a trader can use the LRI on higher timeframes like the 4-hour chart to identify a current market trend. The trader can then switch to a lower timeframe, like the 15m chart, to find potential entry signals using other indicators such as the Oscillators or the Relative Strength Index.
Identifying Entry and Exit Points
The LRI channel can also be used as potential entry and exit points. For example, the high of a bearish channel can be used to take a short position with a profit target taken at the channel’s low, as indicated in the chart below.
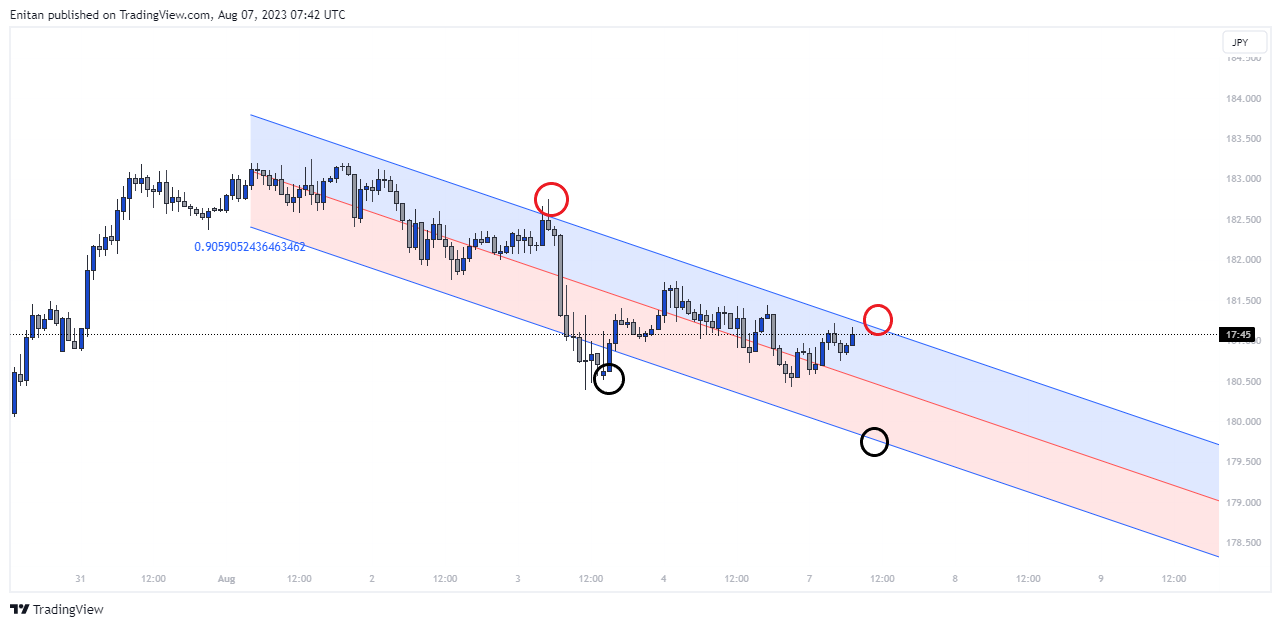
Traders can take short positions using the red-circled points, while the black-circled points can be used as profit targets.
Tips for Interpreting Linear Regression Results in Trading
Some tips for linear regression trading strategies that can be implemented in trading are;
- Trade in the direction of the linear regression indicator, not against it. Professional traders recommend that trading with the trend is beneficial and yield more profits than trading against it. This way, traders benefit when trading with the trend. For instance, it is profitable for a trader to take only short positions in a bearish linear regression channel.
- The Linear Regression Channel has support and resistance lines that act as a border for price. This border should be closely monitored for breakouts so that traders can spot a possible trend reversal.
- The steepness of the slope and channel indicates the strength of the trend. A too-steep channel might indicate a weak trend, which could be short-term. A more balanced and slightly vertical channel shows a stronger trend. Such knowledge can help a trader capitalize on market moves by avoiding risks or maximizing profits. For example, if a trader has identified a weak trend, the trader can choose to reduce leverage and take short profit targets to mitigate risk. A trader can swing potions in a solid, bearish, or bullish direction to maximize profits.
Advantages of Using Linear Regression Indicators in Trading
Removes Human Error
Although the channel looks like a trend line that any trader can draw without using the tool, the LRI indicator uses only the data from the chart to draw its channel. Thus, a trader cannot interfere with or manipulate the channel, however comforting it appears. Such an approach to drawing channels eliminates the potential for human bias in technical analysis, and trading decisions can be made based strictly on price movement.
Simple to use
The LRI is a simple indicator that traders can use for technical analysis. Traders can easily choose the indicator from the list of charting tools and plot on the chart without needing to fill in ambiguous parameters. Also, the LRI is simple to interpret and analyze. Additionally, an instrument’s time and price are the only data needed as parameters, making the LRI model applicable worldwide.
Identifies Market Trend
Traders majorly use the LRI to identify strong market trends, eliminating doubts. Traders do not have to guess if a market is bearish or bullish, as this can be visible when traders use the Linear Regression Indicator.
Gives Valuable Market Insights
Traders can use the information from the LRI to take potential trade positions using the dynamic support and resistance lines. Traders can use the LRI to identify essential price levels such as take profit, stop loss, and entry levels. When a breakout occurs, traders are aware of an impending end to a trend, gain valuable insights into market behavior, and manage trades accordingly.
Limitations of Using Linear Regression in Trading
Even though Linear Regression can be a valuable tool for technical analysis, there are drawbacks to its versatility. Some of these drawbacks are;
Lagging Indicator
Linear Regression relies on historical data to work; hence, it is not guaranteed to predict future price movements accurately. Most times, before the linear regression indicator identifies a trend, the trend is already established; hence, traders should be cautious of a potential channel breakout, a phenomenon often associated with long-term trends.
Limited scope
Other factors can influence market volatility, such as news events. These factors are not accounted for in the LRI because the data obtained from the relationship between time and price does not account for complex data. The limited scope of the LRI does not prepare traders for surprises in market volatility.
Also, the LRI is only helpful in trending markets. Traders may not get valuable information from the LRI in a sideways market. Traders should also note that the LRI is better used with higher timeframes.
Conclusion
Like most technical indicators, the Linear Regression Indicator is subject to current price and time movements and may not accurately predict future market performance. It is beneficial that traders manage their risks accordingly and not rely only on trade signals from the LRI.
However, the LRI can provide reliable market signals because it follows strict statistical principles to market technical analysis, removing human error.
Traders can incorporate the tips for implementing linear regression trading models in their strategies by complementing them with other advanced technical analysis techniques to make informed trading decisions.


