


There are a million and one predictions for the price of Bitcoin in the coming years. For example, Bitcoin has been tipped to reach the $100K mark and even $1 million in the coming years. Interestingly, many of these long-term predictions are based on price prediction tools. One such tool is the Bitcoin rainbow chart. What is the Bitcoin rainbow chart, and how can it be used?
What is the Bitcoin Rainbow Chart?
The Bitcoin rainbow chart is an indicator with nine color bands that are used to predict the long-term price of Bitcoin. The indicator has rainbow-like colors, with cool colors below and warmer colors at its upper range. It uses the historical price action of BTC to project a future trading range.
Although the multiple colors of the chart make the indicator similar to a rainbow, it has some notable differences from a regular rainbow. Its color bands are aligned in a different order from a rainbow’s. It also has slightly different colors from a rainbow, and the indicator lacks a perfect top-to-bottom curve like an ideal rainbow. This is because the rainbow chart indicator was designed to align with Bitcoin’s price movement.
Who Created the Bitcoin Rainbow Chart?
The Bitcoin rainbow chart was first published in 2014 on Reddit by a user with the tag Azop. Azop designed a linear band full of colors and synchronized the price growth of Bitcoin on the channel. The rainbow chart had three main sections – blue for buy, yellow for average, and red for sell. Many Reddit users viewed the chart as a joke or meme at the time.

An initial version of the BTC rainbow chart
The initial rainbow chart was tweaked several times by Azop to accommodate the varying price ranges of Bitcoin. Shortly before the historic Bitcoin bull run of 2017 ended, Azop stopped posting the chart and the new tweaks. The final chart posted made room for the $100,000 milestone. The image below shows the last version of Azop’s rainbow chart posted on Reddit.
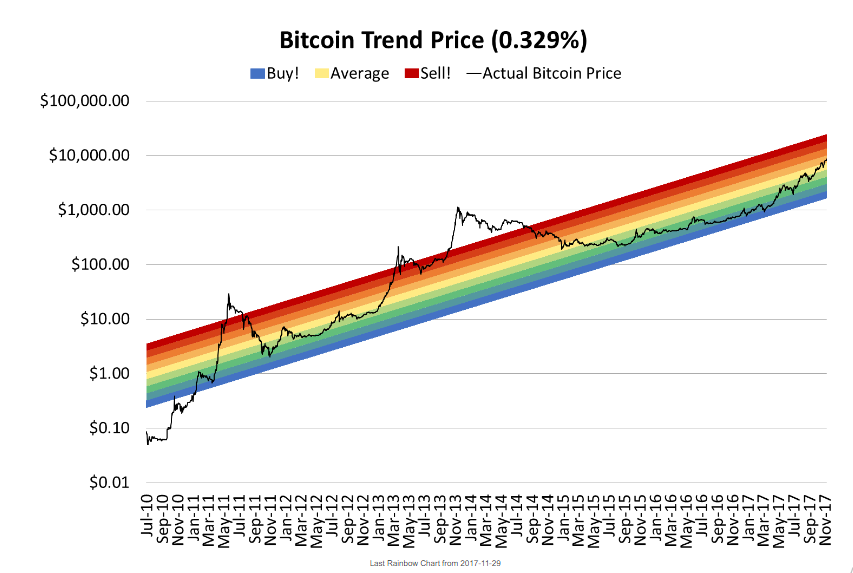
The last Rainbow chart posted by Azop
As time passed, the rainbow chart first created by Azop was modified. The rainbow chart indicator famously used today was modified by a BitcoinTalk user with the tag Trololo. Trololo added a bit of “cherry to the cake” by integrating a logarithmic growth channel rather than sticking with the linear channel.
The logarithmic growth channel implies that the rate of increase in Bitcoin’s price gradually decreased over the years. This new pattern synchronizes with an economic principle – the law of diminishing returns. The law of diminishing returns implies that price appreciation at a steady rate is not sustainable. Hence, in the long run, as the input in a business or an asset increases, the output would increase, but at a slower rate. Thus, investors using the rainbow chart today do not expect steady exponential growth as Bitcoin’s market capitalization increases. The image below shows the modern-day BTC rainbow chart.

How to Interpret the Rainbow Chart Indicator
The BTC rainbow chart has nine colors at present. Each of these nine colors indicates how healthy it is to buy BTC. The chart has the following colors: blue, blue-green, green, light green, yellow, light orange, orange, red, and dark red.
- Blue: The blue zone is the best region to buy BTC. This level is known as the fire sale region because the price is at its lowest low here. Even though BTC’s price seems to be trading at a massive discount here, investors are often scared to jump in. The reason is an open secret. An extremely negative market condition is what leads the price to this level. For example, in March 2020, when the COVID pandemic became intense, stock and crypto prices crashed intensely. Bitcoin plummeted from around the $10,000 level to as low as $3600 during that period. The sharp plummet in BTC’s value sent its price to range around this lowest color level.
- Blue-Green: The blue-green region is called the “buy zone.” Investors often see this zone as a safer phase to purchase BTC than the blue zone because its price would have shown a sign of reversal to the upside at this point.
- Green: This is the accumulation zone for BTC. At this level, BTC’s price is significantly above its lowest low, and early price snippers would already be in profit. Yet, the green zone presents another opportunity for investors to accumulate more coins. Generally, the market sentiment at this price level becomes more positive as more BTC bulls gradually creep into the market again.
- Light-Green: At this price level, Bitcoin is gradually approaching the top. However, investors buying at this point could still make some profits. Investors understand that Bitcoin’s price is still low here.
- Yellow: Bullish sentiment increases when BTC’s price reaches the Yellow zone. However, this may not be the best time to buy. It is also not the best time to sell. The yellow zone is called the “HODL zone.”
- Orange: The orange zone is a bad zone to buy BTC. At this point, the price begins to approach the selling territory gradually. At this price level, naïve investors often ask the question, “Is this still a good time to buy?”
- Light Orange: When Bitcoin’s price gets to this zone, more investors who know little about the crypto market come in. Typically, the news about the price increase in BTC attracts more attention, and novices want to grab a share of the profits too. Hence, retail and institutional interest in Bitcoin increases as the crypto market gains further traction. The light orange zone is known as the “FOMO zone.”
- Red: This is one of the worst possible price levels to buy BTC. The red zone is the sell zone. Since red is often used to identify dangers, this zone tells buyers it is dangerous to buy. At this price level, BTC is already overvalued. But guess what? This is not still the most dangerous region to buy.
- Dark Red: The dark red region is the most dangerous region to buy BTC. It is the maximum bubble territory. If the price eventually gets to this region during a bullish run, investors who held up to this point can make the most profits when they sell. The dark red zone tells shrewd investors that a price crash is looming.
The Benefits of the BTC Rainbow Chart Indicator
- The BTC rainbow chart indicator is one of the easiest indicators to interpret. Giving meaning to its colors and spotting significant price levels is as easy as interpreting the colors on a traffic light.
- Although no indicator is 100% accurate, the Bitcoin rainbow chart indicator has been fairly or near accurate since its creation.
- The indicator gives room for modification and improvement. The BTC rainbow chart indicator we have today can be upgraded for better results in the near future.
The Limitations of the BTC Rainbow Chart Indicator
- Short-term traders may not find the rainbow chart indicator helpful. It cannot be used for scalping or short-term price analysis.
- Just like other indicators, the rainbow indicator is not 100% accurate. The indicator has buy, sell, and HODL zones, but these zones may not always be respected in detail. Bitcoin’s price could crash further from the HODL zone, and it may take a long time for price to recover after the crash.
The Rainbow Chart Prediction for Next Year (2024)
According to data from the rainbow chart, 2024 will be a bullish year for Bitcoin. For 2024, the rainbow indicator predicts that BTC’s lowest possible price will range between $20,000 and $26,000 in the first few weeks. Its fair value would be between $62,000 and $82,274. Its highest range at the start of the year is tipped to be between $181,000 to $246,000.
At the end of the year, BTC is expected to have the lowest possible value of $28,500 and a maximum value prediction of $331,315. Bitcoin’s fair value range for the end of 2024 falls between $85,000 and $113,000.
Notably, the bullish expectation for Bitcoin in 2024 is partly due to the upcoming halving. Bitcoin has undergone three halvings in its history, and the fourth will occur in 2024. Bitcoin halving typically reduces block rewards for miners, making BTC scarcer. The expected scarcity created by the slash of block rewards usually drives Bitcoin’s value up in the months after halving.
The Rainbow Chart Prediction for 2030
The rainbow chart prediction for BTC in 2030 is also bullish. Notably, the rainbow chart’s logarithmic growth channel implies that Bitcoin’s price may not soar exponentially as much as it did in previous years with a smaller market cap.
BTC is expected to have a minimum range between $127,000 and $163,000 at the start of 2030. The estimated highest value ranges between $895,000 and $1,186,000. The chart also predicts a fair value between $346,000 to $445,000 in 2030.
Conclusion
The Bitcoin rainbow chart is easy to interpret thanks to its distinct color ranges. Also, the chart modifications have helped price analysts reach more realistic price expectations for Bitcoin over the years.
While the rainbow chart has effectively determined price ranges various times in the past, it should not be wholly relied on. Past success in predicting the price of an asset does not guarantee future results. Since the chart does not account for many other factors that could influence Bitcoin’s price, crypto analysts should not base their investment advice solely on the rainbow chart predictions.

