


Bonk, the dog-themed memecoin on the Solana network, caught the eyes of investors on the 15th of December, 2023. After Binance announced that it would be listing the crypto asset on its marketplace, the token experienced a price surge.
Late last week, Bonk reached a new all-time high, just about a year after its launch. Recall that the Bonk token was launched late in December 2022 to help boost the crumbling liquidity in the Solana ecosystem. At the time, active builders and key projects in the Solana ecosystem were massively rewarded.
During the week of its launch last December, the token saw a 4000% increase. Eventually, the hype died down, and the Bonk ecosystem gradually became less boisterous. More recently, though, the dog-themed coin began to bark again. BONK reached an all-time high of $0.0000349 on the 15th of December, surpassing even famous memecoins like SHIBA INU in value.
With Bonk’s recent reignition to fame, what can investors expect? Will the memecoin continue to soar, or should Bonk holders expect a pull-back? Let’s take a look at the charts.
Technical Analysis of BONK: What is its Short-Term Price Prediction?
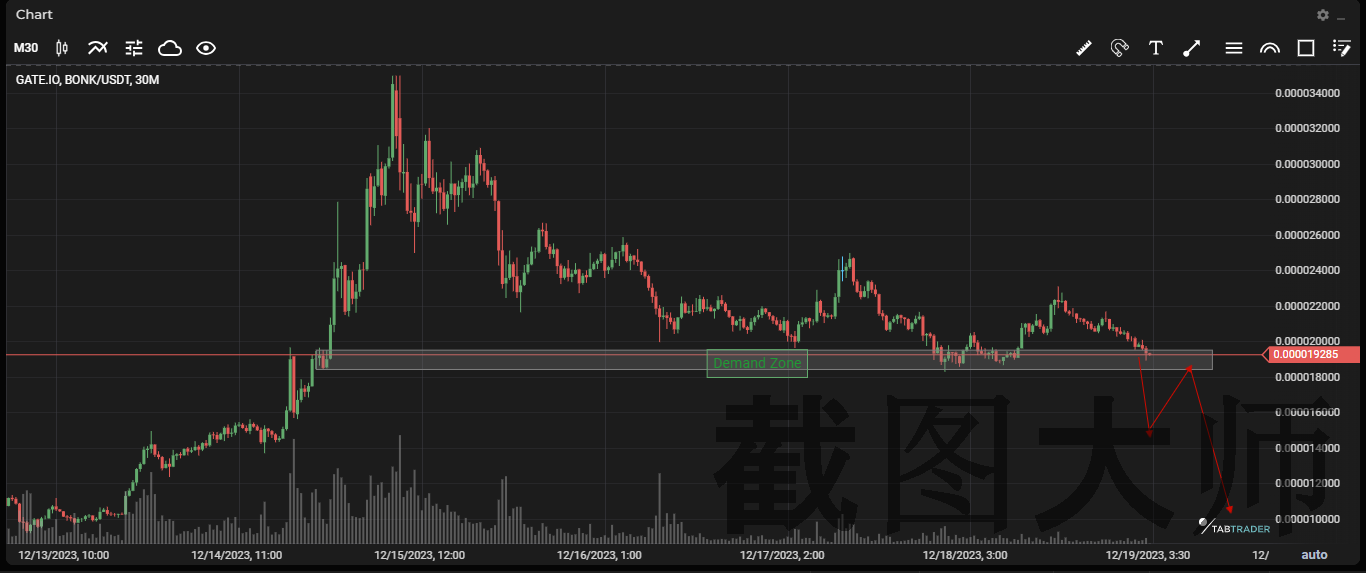
Technical Analysis of BONK [Image Source: Tabtrader]
From the chart above, the Bonk token is currently on a downtrend. The chart pattern clearly reveals a formation of lower highs and lower lows since reaching its all-time high of $0.0000349.
Using the 30-minute timeframe, the chart reveals that Bonk is currently approaching a demand zone. While traders typically expect a bounce-back or rise in price from demand zones, this demand zone could be different. The reason is an open secret – it has been tested initially.
The first time Bonk’s price approached this demand zone, the token bounced from around $0.0000183 to $0.0000231. Notably, the buy volume lacked enough intensity to push the price above the resistance at the $0.0000245 level. This clearly indicates a lack of bullish momentum.
Hence, as the price approached the tested demand zone for the second time, traders can expect a break in structure to the downside. That’s because a tested demand zone is weaker than an untested one.
Typically, a break in demand and supply zones could be accompanied by a retest. Hence, traders can wait for its price to retest the $0.0000183 region before opening a sell position. Note that the price analysis above would be invalidated if the price respects the demand zone. Thus, a huge influx of buy orders around the $0.0000183 region could reignite bullish momentum for BONK.
The Bigger Picture
Although BONK’s short-term price analysis reveals that the token is on a downtrend, the memecoin could still be an excellent long-term investment. The Solana memecoin has built an active community just one year after its launch.
The protocol also has a solid foundation and has proven that it could compete with the likes of Shiba Inu and Pepe. At the moment, BONK has a market capitalization of $1.17 billion. It also occupies the 54th rank in the cryptocurrency market. This is an impressive feat considering that there are about 9000 active cryptocurrencies currently, and the memecoin is relatively new.
Finally, if the cryptocurrency market replicates the previous bullish season of 2021, where several memecoins almost literally reached the moon, BONK investors could rake huge profits in the coming year.


